 ColonyCat
Reporting
The report builder lets you assemble your own views of your data, save them, run them, and export to a spreadsheet. Want a list of every cat that still needs TNR, with its colony and last vet visit? A roster of colonies with cat counts and last feeding date? A clinic-by-clinic tally of trap nights? You build it once, name it, and run it whenever you like.
This chapter covers who can use Reporting, building a report, running and filtering it, and exporting.
Who can use it
Reporting is part of the Pro plan and up (Pro, Max, and our Founder/Partner tiers), and it's for organizers: OrgAdmins and OrgStaff. Regular volunteers don't see it. Everything a report shows is your own organization's data, scoped automatically, so a report can never reach another group's cats or colonies.
You'll find it at 📊 Reporting in the navigation once your plan qualifies.
What you're about to do
- Open 📊 Reporting and start a new report.
- Pick a data source, choose columns, and order them.
- Name the report, decide whether to share it, and save.
- Run it, sort and filter on screen, and export what you see.
- For very large reports, download a CSV instead.
Step 1: Open Reporting
Tap 📊 Reporting. You land on your saved reports. Each row has three quick actions: ▶️ Run, ⬇️ Download CSV, and ✏️ Edit. A report is either 🔒 Private (only you can see it) or 👥 Shared (any organizer on your team can run it).
Tap the ➕ at the top to start a new one.
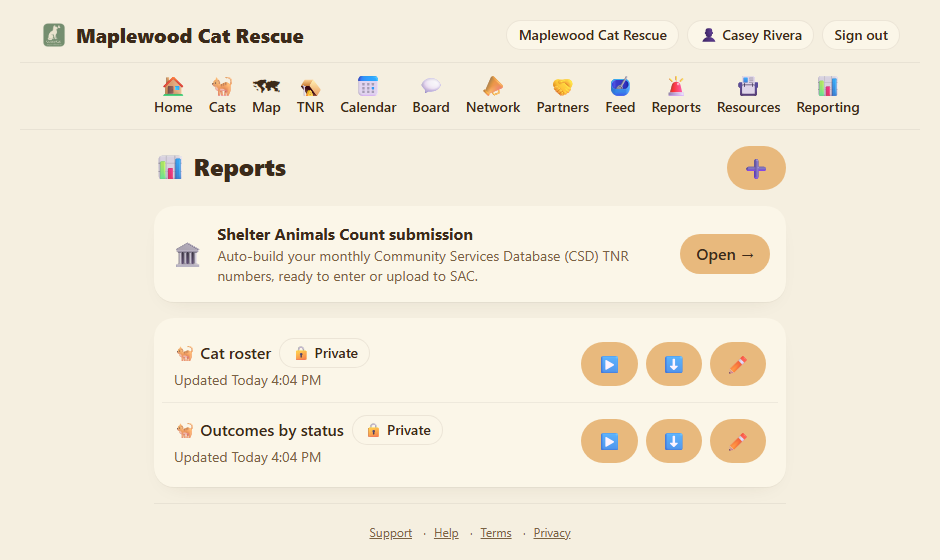
The very first card on this page, above your saved reports, is 🏛️ Shelter Animals Count submission. That's a ready-made report you don't have to build. It's covered next.
Shelter Animals Count (SAC) submission
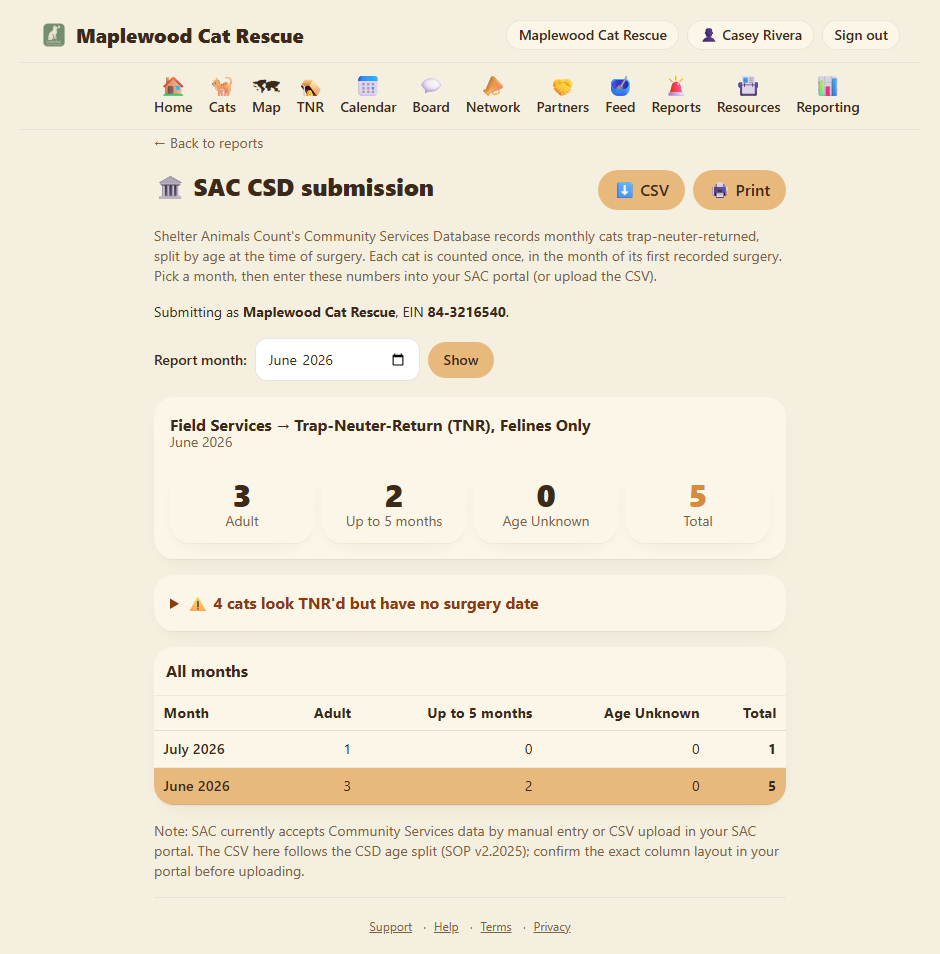
If your group reports to Shelter Animals Count, the Community Services Database (CSD) wants your monthly trap-neuter-return numbers. ColonyCat builds them for you. Tap the 🏛️ Shelter Animals Count submission card at the top of the Reporting page, or go to yourgroup.colonycat.org/reporting/sac-csd.
What it counts. Every cat your group sterilized, filed under Field Services → Trap-Neuter-Return (TNR), Felines Only, split three ways by the cat's age at the time of surgery:
- Adult
- Up to 5 months
- Age Unknown
with a Total alongside.
One cat, counted once. Each cat lands in exactly one month: the month of its earliest recorded surgery date on a TNR catch. A cat you trapped in one month and had surgery in the next is counted in the surgery month. The age split comes from the age at service you recorded on the catch (a kitten counts as "Up to 5 months").
Pick a month. The page opens on the previous complete month. Use the Report month picker to choose another, or click any month in the All months table lower down to jump to it. The big tiles at the top show that month's Adult / Up to 5 months / Age Unknown / Total.
Your EIN. SAC accounts are keyed to your organization's EIN. Set it once on your Organization profile in the Organization EIN field, and the page shows "Submitting as [your group], EIN ..." so you know the numbers map to the right SAC account. Until you add it, you'll see a reminder at the top.
The review list. Below the numbers, a collapsible panel flags cats that look TNR'd (ear-tipped, marked Returned, or carrying a TNR record) but have no surgery date on any catch, so they aren't counted anywhere. If your group did the surgery, open the cat and add the surgery date to its catch record and it rolls into the totals. If another group did it, you can leave it out, since SAC counts the sterilizations your own org performs.
Getting the numbers out. ⬇️ CSV downloads every month at once. 🖨️ Print opens your browser's print dialog, so you can print the page or save it as a PDF. SAC currently takes CSD data by manual entry or CSV upload in your SAC portal. Confirm the exact column layout in the portal before you upload, the CSV follows the CSD age split but the portal's columns are the final word.
Step 2: Build a report
A report is built from two panels: Available columns on one side and In this report on the other. On a phone these stack, with the available columns on top.
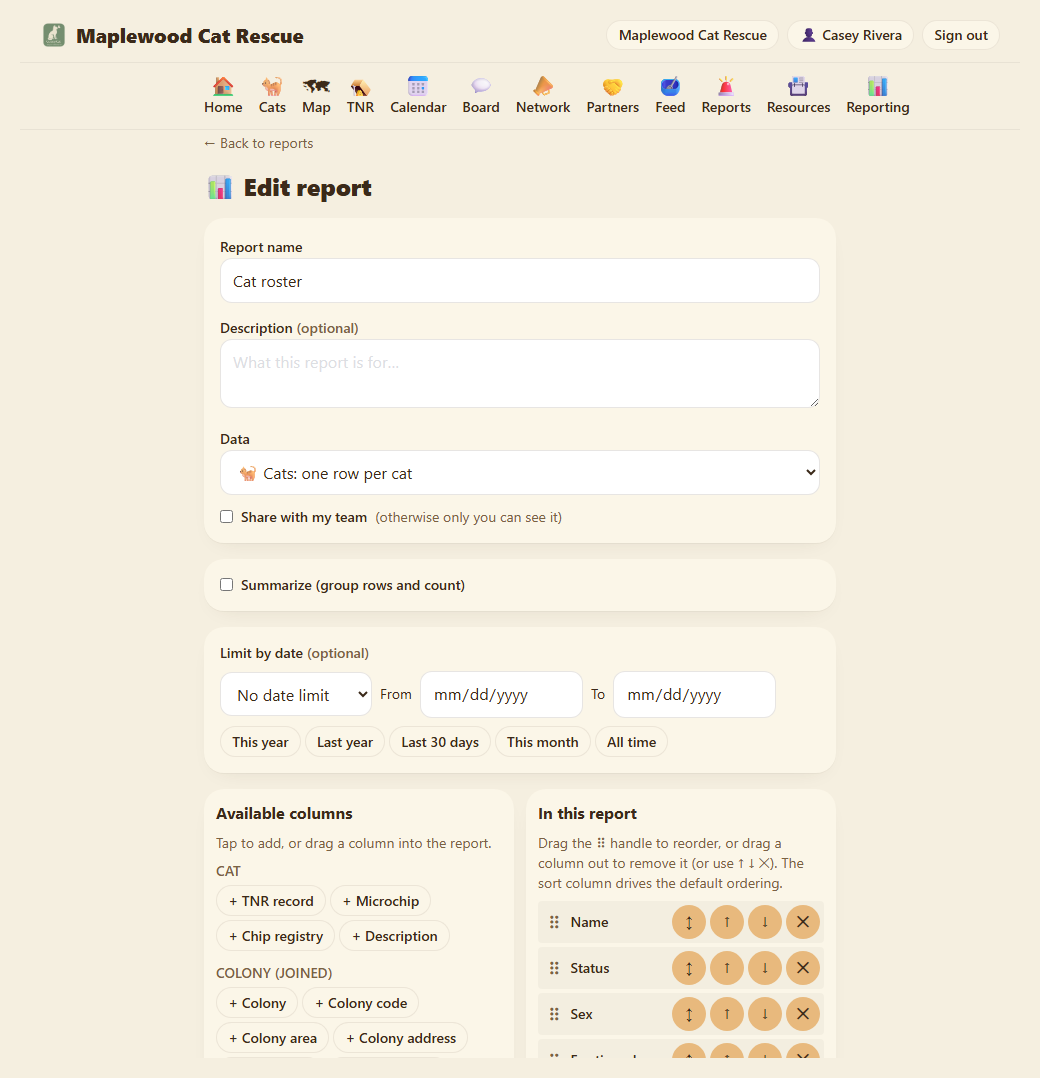
Pick your data. The Data dropdown chooses what each row represents: Cats, Colonies, Feedings, TNR trap nights, Reports inbox, or Resources (your saved clinics, rescues, pantries, and other contacts, one row per resource). Changing it clears your column picks, since columns belong to a data source.
Add columns. Tap any column under Available columns to add it, or drag it across into the report. Columns are grouped to make them easy to find. For Cats, Feedings, and TNR you'll also see a Colony (joined) group: every field from the cat's (or feeding's) colony, like the colony name, area, status, and caregiver.
Order and remove. In the In this report panel, drag the ⠿ handle to reorder, or use the ↑ ↓ buttons. To remove a column, drag it back out of the panel or tap its ✕.
Set the sort. Each column in the report has a sort toggle. Tap it to make that column the default sort, and tap again to flip between A to Z and Z to A. The arrow shows which way it's pointing.
Name and share. Give the report a clear name (for example, "Cats still needing TNR") and an optional description. Tick Share with my team to make it visible to your fellow organizers, or leave it unticked to keep it private to you.
Save. Tap Save report. You're back on the list, with your new report ready to run.
Step 3: Run it
Tap ▶️ Run (on the list) or open a report and run it. You get a table of every matching row, with a count at the top.
Sort. Tap any column heading to sort by it. Tap again to reverse. This only changes what's on your screen; it doesn't alter the saved report.
Filter. Tap the small ▾ next to a column heading to filter that column. The filter matches the kind of data:
- Text columns: type a few letters to keep rows that contain them.
- Yes/No and category columns: tick the values you want to keep.
- Number columns: set a minimum, a maximum, or both.
- Date columns: pick a quick range (Today, Last 7 days, Last 30 days, This month, This year) or set your own From and To dates.
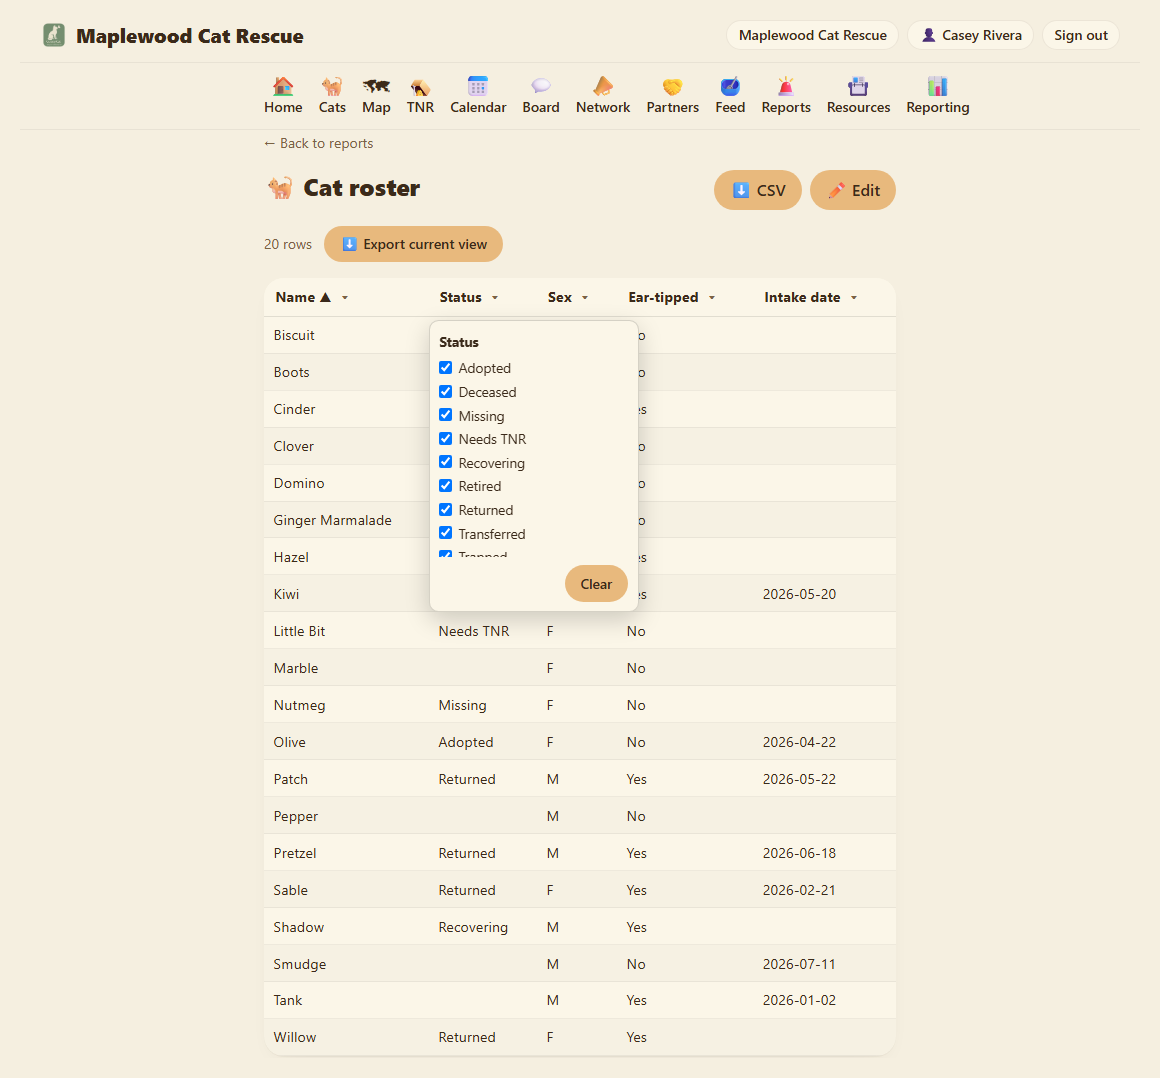
Filters stack, and the count updates to "X of Y rows" as you narrow things down. Clear filters resets them.
Export what you see. ⬇️ Export current view downloads exactly the rows currently showing, after your filters and sort, as a CSV file you can open in Excel, Google Sheets, or Numbers.
Step 4: Large reports
If a report returns more than a couple thousand rows, it's too big to draw on screen comfortably, so instead of a table you'll see a prompt to download it as a CSV. The ⬇️ CSV button (on the report and in the list) always gives you the full result set, filters or not, straight to a file.
Summarize: group rows and count
Sometimes you don't want a list of every cat. You want the numbers: how many cats are in each status, how many trap nights per clinic, how many cats taken in each month. That's what Summarize does.
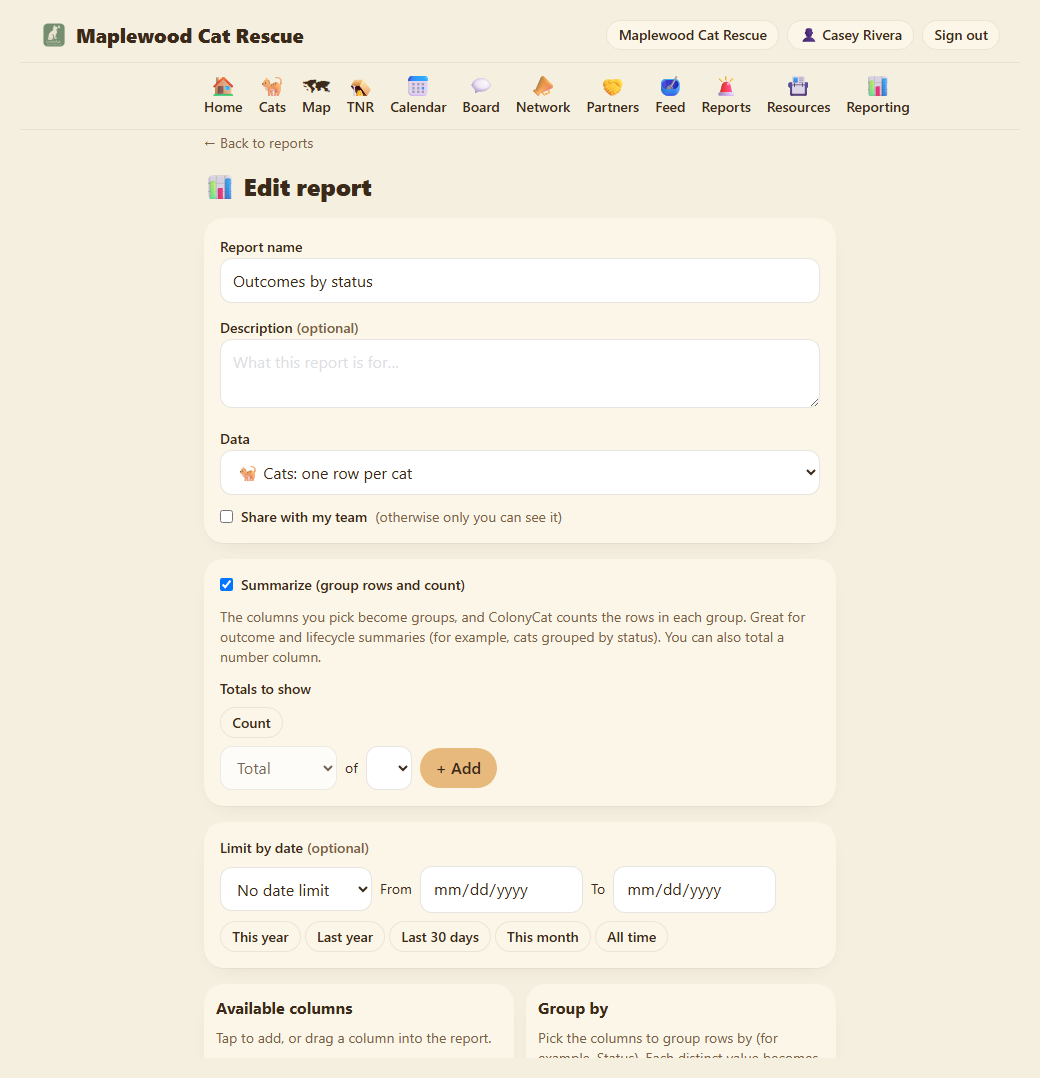
In the builder, tick Summarize (group rows and count). Two things change:
- The right panel becomes Group by. The columns you add there are the groups. Each distinct value becomes one row, with a Count of how many records fall into it. For example, group Cats by Status and you get one row per status with its count.
- A Totals to show box appears. Count is always included. You can also add a Total, Average, Minimum, or Maximum of a number column (for example, total Cats seen across feedings).
A date column used as a group is bucketed by month, so grouping Cats by Intake date gives you a tidy "intakes per month" breakdown instead of one row per day. Leave the Group by panel empty and you get a single grand-total row.
Limit by date. Below the Summarize box is Limit by date. Pick a date column (for example, Intake date) and a From/To range, or use a preset (This year, Last year, Last 30 days, This month). This window is applied before the counting, so your totals cover exactly the period you chose. When you run the report you can change the range right at the top of the results without editing the report, which makes the same report reusable year after year.
This is the tool for outcome and lifecycle reporting, like a Dept of Ag license renewal or a grant report: group cats by status over an intake-date window to account for how many came in and where they ended up. You build it yourself, a new org starts with no saved reports, so follow the recipe in "A few good first reports" below to make an outcome-summary report and save it.
Editing, sharing, and deleting
Open a report and tap ✏️ Edit to change its columns, name, sharing, or sort. You can edit a report you created; OrgAdmins can edit any of the team's shared reports. To remove one, open it for editing and tap 🗑 Delete report. Deleting a report only removes the saved definition, never any of your actual cat, colony, or clinic records.
What the builder can't do yet
So you don't go hunting for buttons that aren't there, here's what the report builder doesn't do today:
- No distinct counts. Summarize counts records, not unique cats. If the same cat appears in two trap nights, a count of trap-night rows counts it twice. For a "each cat once" number, like a SAC submission, use the Shelter Animals Count report above, which is built to dedupe.
- No cat-age column. You can report a cat's status, intake date, sex, and so on, but there's no age or date-of-birth column to add. (Age at the time of a surgery does drive the SAC report's age split, but it isn't a column you can pull into a custom report.)
- No saved templates. There's no library of prebuilt reports to start from. You build each one from scratch, then save it and reuse it. The recipes below are a good starting point.
- No scheduled delivery. Reports don't email themselves on a schedule. You run or download one when you need it. There's nothing to set up and nothing that arrives on its own.
A few good first reports
- Cats still needing TNR: Data = Cats, columns Name, Status, Colony, Intake date. Filter Status to "Needs TNR."
- Colony overview: Data = Colonies, columns Name, Area, Status, number of cats, last feeding date.
- This month's surgeries: Data = TNR trap nights, columns Trap date, Colony, Clinic, number caught. Filter Trap date to This month.
- Clinic usage: Data = Resources, columns Name, Phone, number of trap nights.
- Outcome summary (counts): Data = Cats, tick Summarize, Group by Status, Count. Under Limit by date pick Intake date and a range (for example, This year). One row per status with its count, for the period you chose.
Build one, run it, tweak the columns, and save. Once it's how you like it, it's one tap away whenever you need it.